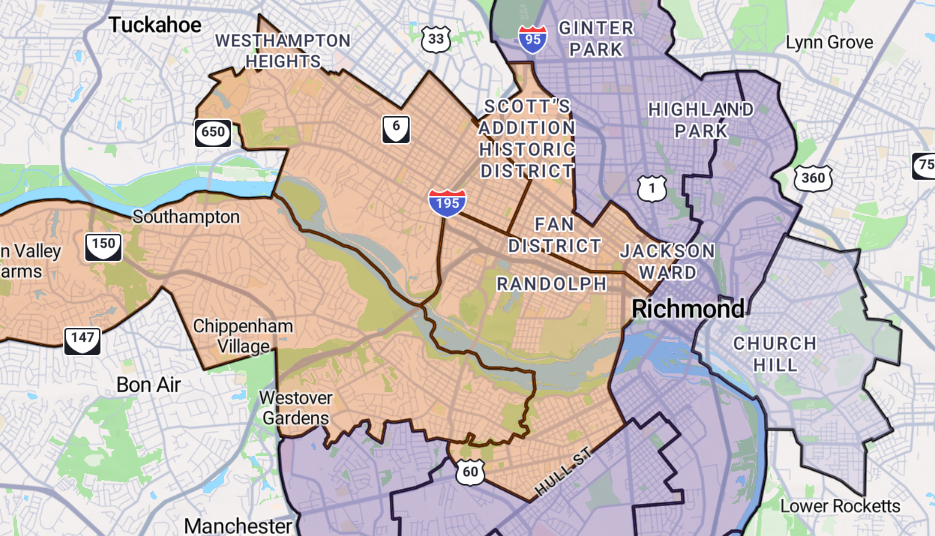
Map: Visualizing Richmond's changing demographics
Over the past two decades, the demographic makeup of Richmond has changed dramatically, but what it means for this year's mayoral election remains to be seen.
The city is divided into nine districts. To win on the first ballot, a candidate must have a plurality of the votes (more than any other candidate) in five of the nine. It is possible for a candidate to win the election without winning the popular vote, similar to the Electoral College system used to elect the U.S. President.
The five-of-nine system preserved the voting strength of Black communities for years. However, the city’s Black voting age population fell from 51.5% in 2000 to 38% in 2020, according to U.S. Census data.
The Latino voting age population, meanwhile, jumped from 2.5% to 9%, bringing a new dimension to a city long accustomed to thinking in terms of Black and white.
For the first time, Richmond will elect a mayor on a map where only four of the nine districts have a Black majority. District 7 (Church Hill) does not have a majority, and Districts 3 and 6 now also carry increasingly balanced demographics.
Below, find a district-by-district look at Richmond's demographics.
For more on the mayoral election, read the primer written by Graham Moomaw.