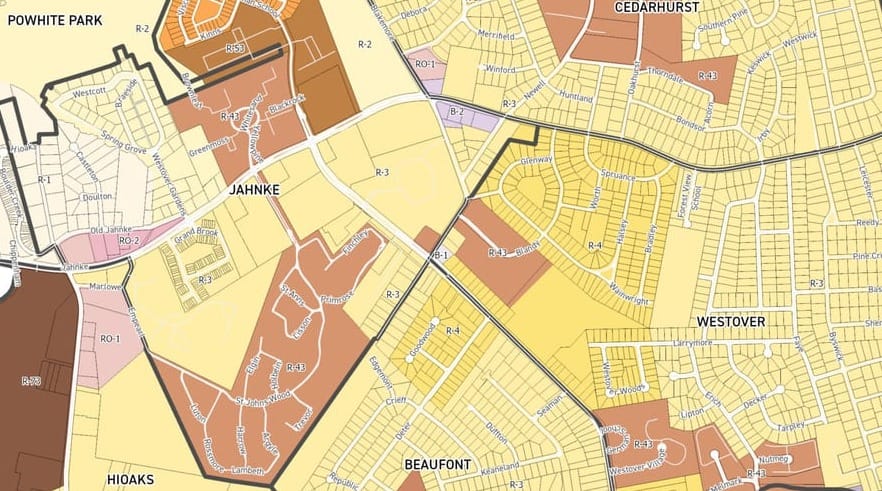
Here is the first draft map of how Richmond could be rezoned
Want to know how your neighborhood could be rezoned under Richmond’s ongoing overhaul of its zoning code?
Now you can, after the draft map of proposed new zoning districts went live last month. Click here to view it in interactive form or see the embedded map below. A PDF version is also available here (warning: you’ll need to zoom in vigorously).
Until yesterday, members of the city’s Code Refresh Zoning Advisory Council — a group of not only land use and development experts but also regular citizens — were adding their comments to the map about what they think looks good, what should be changed and what might need further discussion. Those can also be viewed if you open up the map in its own tab to get a better sense of what some of the people guiding the process are considering ahead of their June 11 meeting.
Nothing in the map is considered final. Kevin Vonck, the city’s director of planning, told The Richmonder that “the map will change based on community input over the next several months.”
“We have tens of thousands of parcels, so we acknowledge we may have not mapped every single one appropriately,” he said. “That is why it is so important to have as many eyes as possible on it.”
Richmond began the process of overhauling its 1970s-era zoning code last year in an effort to bring its land use rules more in line with how people are living and working in the early 21st century. The new zoning will also work toward realizing the vision of the city’s future laid out in Richmond 300, the city’s master plan that was approved by Council in December 2020.
According to Vonck, the first draft focused on four factors:
- Furthering the future land use map in Richmond 300
- Cutting down on the number of residential structures that are “nonconforming,” meaning that the current zoning wouldn’t allow the existing structure to be rebuilt
- Allowing “slightly increased intensity and density” aligned with the “enhanced transit map” in Richmond 300
- Allowing “greater intensity and density” at national and regional nodes identified in Richmond 300
Read more: