Cool start to September probably doesn't mean a snowy winter in Richmond
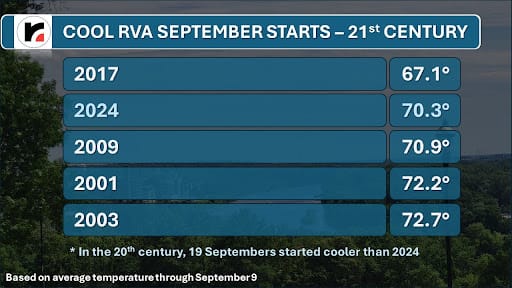
Richmond is having its coolest start to September since 2017, prompting early thoughts about what winter might bring. Coincidentally, a couple of farmers’ almanacs recently released their winter outlooks.

Much like Groundhog Day, the emotional and cultural affection for the almanacs is strong, and as meteorologists, we are often quietly asked how accurate their outlooks are. Unfortunately, the methods used by the almanacs to produce the forecasts are largely kept secret, leading to visions of a forecast from a Magic 8 Ball or Ouija Board, and making it difficult to understand how the authors reached their conclusions.
Paul Knight, a retired Senior Lecturer in Meteorology from Penn State, faced that question for decades. He was creator and co-host of the long-running weather magazine show at Penn State, Weather World.
“We did a monthly series about verifying the Farmers Almanac from about 1994 to 2001,” said Knight. “I don't recall the specific scores, but we used a letter grade and rarely did the almanacs get an ‘A’ and often the grade was a 'C'.”
Understanding of weather and climate has advanced over the last few decades, leading to more legitimate skill in seasonal forecasting.
The value of a seasonal forecast
Dr. Jan Dutton is a meteorologist in Charlottesville and CEO of World Climate Service, and their client base of electric power traders and natural gas traders has an immense financial interest in monthly and seasonal forecasting.
Not surprisingly, temperature correlates strongly with demand for electricity. Even a rudimentary insight into an upcoming period that will be warmer or cooler than normal has phenomenal value.
“There are contracts on these commodities that are bought and sold over a huge range of time scales — within the day, the next day, the next week, or a month ahead. Trillions of dollars are likely traded annually in these areas,” said Dutton.
Realistically, if the almanacs were as good as they suggest, they would not sell them for ten dollars. The value of accurate seasonal forecasts is far greater.
But the value is not solely measured in money, World Climate Service has been working with the Food and Agriculture Organization of the United Nations since 2005. Among their many analyses, their outlooks help determine the risk of crop-destroying locusts in northern Africa and the Arabian peninsula.
No forecasts are perfect. But these seasonal outlooks are more about probability than high-precision.
How a seasonal weather outlook works
A traditional weather forecast goes out for a few days, capturing the initial state of the atmosphere, then predicting it up to several days in advance with complex equations describing how the atmosphere works.
Seasonal outlooks are different. Rather than the initial state of the atmosphere, this type of forecasting examines current global patterns of ocean temperatures, snow cover, and soil moisture. These conditions on the ground interact with the atmosphere immediately above them, impacting how heat and moisture feed into the atmosphere from ground level. Also known as analog forecasting, it involves recognizing similar patterns in the past and knowing what happened afterwards.
El Niño (and its opposite, La Niña) is the best known of these patterns, but there are several others. How they interact with one another provides insight on future conditions. They are not guarantees, but they favor certain outcomes.
For example, warm ocean water in the Atlantic Ocean and a La Niña in the Pacific Ocean favor a busy Atlantic hurricane season. But there are different intensity scales in those patterns, and there are smaller fluctuations embedded within them. We are seeing that happen now, as the first half of hurricane season has not been as busy as expected.
If you are a baseball fan, think of it as Moneyball for weather.
“It is a game of chances,” said Dutton. Effectively, these patterns load the weather dice toward a certain result, but do not guarantee that result. Imagine changing the 1 on a pair of dice to a 7 and rolling them several times. Instead of values between 2 and 12, they are now between 4 and 14. Compared to a standard pair of dice, higher value rolls are now favored.
The impact of warming
This idea also mirrors the warming climate, which has introduced another variable.
“Forecasting a warmer than normal winter is likely to be correct, as normal is based on the previous 30 years,” said Dutton. “So analogs become less relevant.”
That winter warming trend has already emerged in Richmond, as winter nights are not as consistently cold. Over the last 30 years, Richmond has averaged 9 nights below 20 degrees between November 1 and March 30. In the previous 30 years, it was 17.
In the last 5 years, that number has dropped to 3.
Similarly, snow totals are melting away. Over the entire 20th century, Richmond averaged 12.9 inches a season. The last winter above that average was 2018-19 (13.1 inches), and the last 5 seasons have averaged 2.8 inches.
Skill is improving in these outlooks as a merging of these two forecasting techniques is evolving. Computing power and observational technologies have each gotten better.
Regarding this coming winter, Dutton feels it is too soon.
“Our public winter outlook will be released in November,” he said.
But there are a couple of clues.
The developing La Niña is well known to favor a warmer winter in Virginia. And another major driver, known as the Pacific Decadal Oscillation, is also in a phase that favors a warmer winter in Virginia.
This year’s roll of the winter dice might still bring cold and snow to Richmond, but given the warming climate of the last couple of decades and what is going on upstream from us in the Pacific Ocean, cold and snowy is probably not the safest bet.


